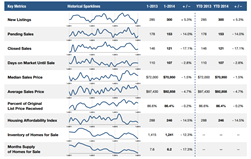
Hot Springs Village 3-Year Real Estate Market Trends

Sales in Hot Springs Village from 2011 through 2013 show the following trends:
- For Jesseville School District, the number of sales increased by 15.5%, and the sale prices and average days on market did not show a significant change.
- Fountain Lake School District, had a whopping 32% increase in the number of sales, no measurable change in sale prices, and a decrease in average days on market of 22%.
Click on 'Read More' to see the actual sales statistics for 2011, 2012 and 2013.
We're looking forward to a brisk selling season this Spring and Summer as the real estate market and the weather heat up. Vacation rentals are booking up now as anxious golfers and boaters are making their plans.
Hot Springs Village -- Jesseville School District
| Year | # of Sales | Average Sale Price | Price Per Sq Ft | Avg Days on Market |
| 2011 | 161 | $118,729 | $67.05 | 120 |
| 2012 | 159 | $120,197 | $66.27 | 150 |
| 2013 | 186 | $115,167 | $63.94 | 127 |
Hot Springs Village -- Fountain Lake School District
| Year | # of Sales | Average Sale Price | Price Per Sq Ft | Avg Days on Market |
| 2011 | 233 | $227,507 | $98.59 | 136 |
| 2012 | 270 | $225,476 | $96.85 | 128 |
| 2013 | 308 | $228,517 | $97.39 | 106 |
- Cheryl Bourland's blog
- Login or register to post comments
 Google+


 Information Deemed Reliable but Not Guaranteed. CENTURY 21 H.S.V. Realty is licensed in the state of Arkansas. CENTURY 21 and the CENTURY 21 Logo are registered service marks owned by Century 21 Real Estate LLC. H.S.V. Realty, Inc. fully supports the principles of the Fair Housing Act and the Equal Opportunity Act. Each franchise is independently owned and operated. Any services or products provided by independently owned and operated franchisees are not provided by, affiliated with or related to Century 21 Real Estate LLC nor any of its affiliated companies.